Structured Data: Making Your Data Work for You
From PhenoTips’ Head of Product Krista Pace, explore the benefits of structured data and how it’s the backbone of what makes PhenoTips a game-changer in the field of genomics.
Krista Pace

From PhenoTips’ Head of Product Krista Pace, explore the benefits of structured data and how it’s the backbone of what makes PhenoTips a game-changer in the field of genomics.

It can often feel like there’s not enough time to collect patient and family data, organize it, comb through it, and analyze it, all while offering your undivided attention to patients, because there simply isn’t. While making sure your data is structured from the start sounds like even more work, it’s actually the opposite. In fact, you’ll find the headache of managing and gaining insights from your data melts away. And with technology like PhenoTips making the initial structuring simple, you’ll re-gain the most precious clinical resource: time.
Structured data isn't just a fancy buzzword that gets tossed around in the world of healthcare; it's the key to unlocking a treasure trove of insights. Imagine your clinical information neatly organized, making it easy to search, analyze, and gain meaningful insights. With structured data, you bid adieu to the chaos of scattered notes and welcome a streamlined approach that lets you focus on what truly matters: patient care and groundbreaking research.
But what does it mean to have structured data? At its core, structured data refers to organized and categorized information that follows a predefined format, allowing for efficient storage, retrieval, and analysis.
PhenoTips is all about harnessing the power of structured data to supercharge your clinical and research efforts. With every entry you make, from symptoms to family histories, you're creating a structured canvas that paints a clear picture of each patient's unique story. This structured approach not only enhances your workflow but also lets you uncover hidden patterns and connections.

Let's talk about ontologies and taxonomies, and how PhenoTips uses them to enrich your data.
An ontology is a structured framework that both defines and organizes the relationships between various terms and concepts in a specific domain. It's like a carefully curated dictionary that not only lists terms but also explains how they relate to each other. In the world of genetics and genomics, ontologies are a powerhouse. They help ensure that terms are used consistently across research, clinical care, and communication, making it easier to collaborate and share insights.
Taxonomy, on the other hand, is all about classification. It's like arranging items on a shelf according to categories, creating a logical order that simplifies understanding. In genomics, taxonomy helps categorize genes, diseases, and other entities, allowing you to quickly access relevant information when you need it most.
PhenoTips lets you tap into these resources, fully integrated with the Human PhenoType Ontology (HPO), Online Mendelian Inheritance in Man (OMIM), and HUGO Gene Nomenclature Committee’s GeneNames (HGNC), with more to be added in the future!

Structured data empowers you to effortlessly compare and contrast patients, allowing you to spot trends that might otherwise go unnoticed. By setting a baseline for the way data is collected and recorded, it means you’re now able to compare apples to apples without putting effort into cleaning and curation.
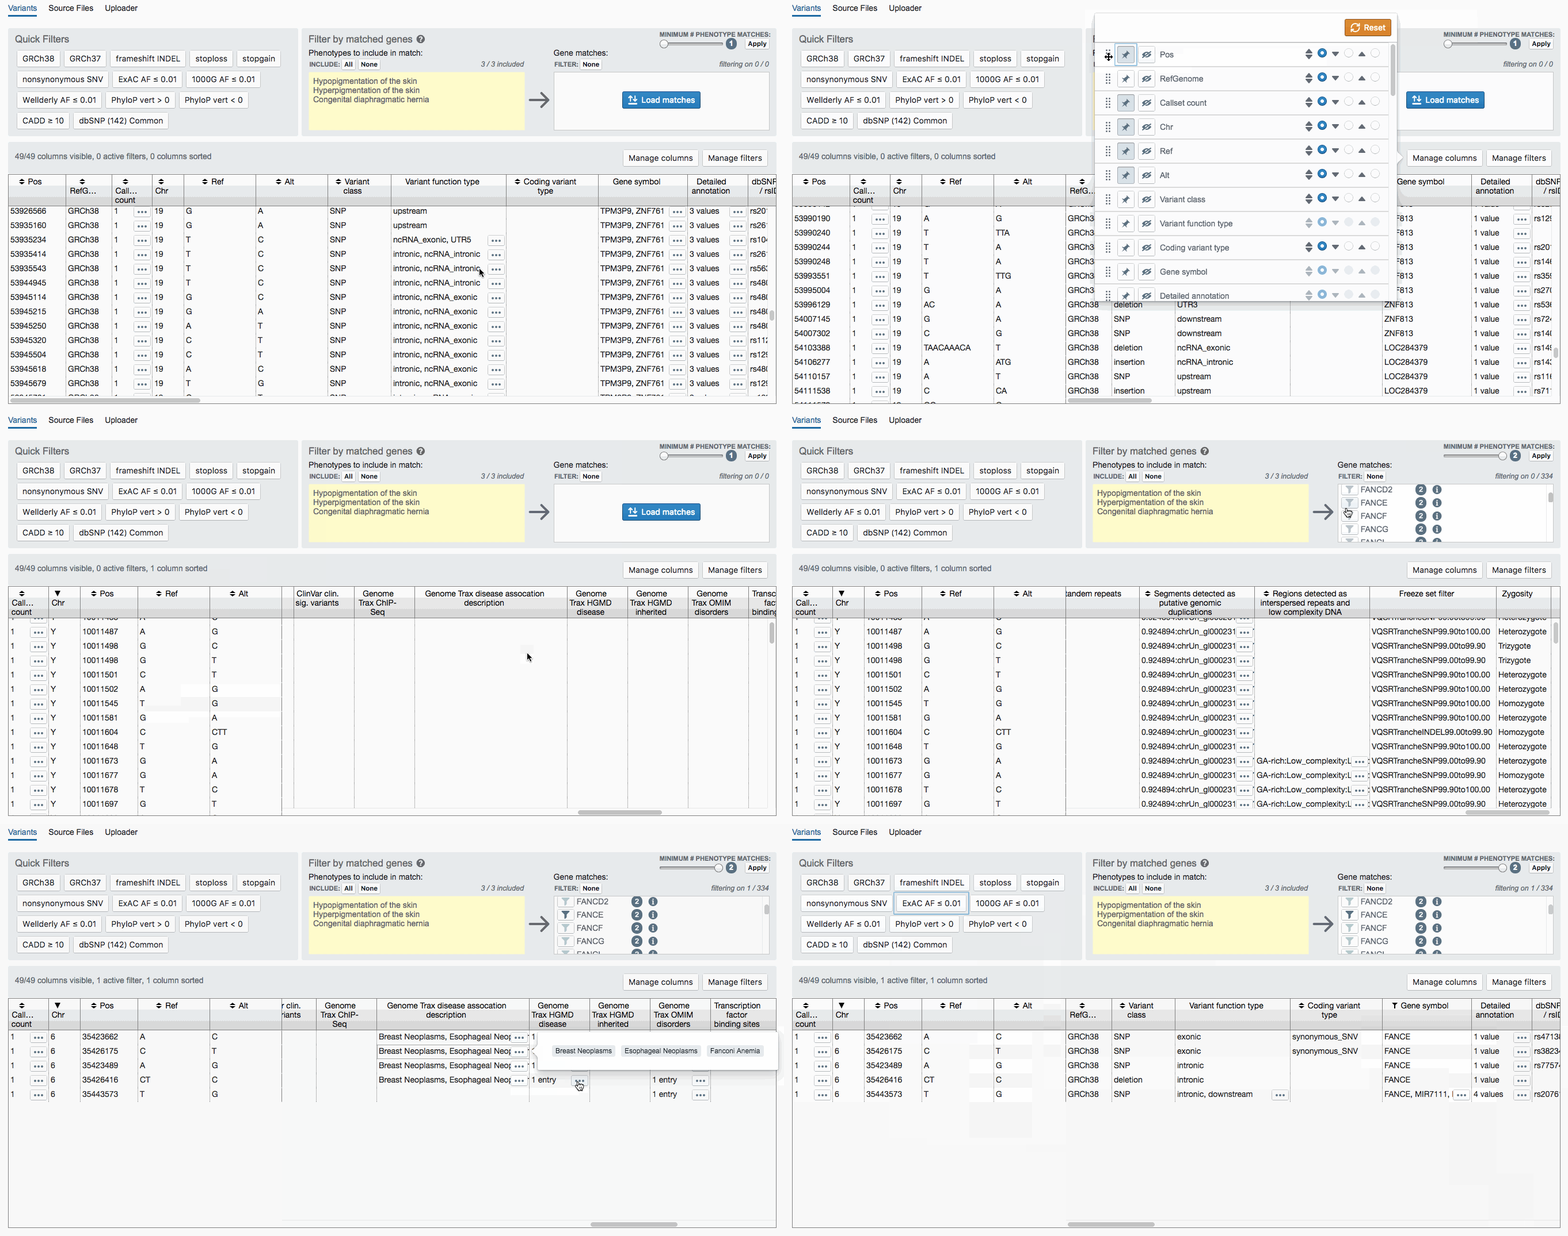
Imagine this: You're presented with a patient whose symptoms puzzle even the most seasoned practitioners. With structured data at your fingertips, you're equipped to examine not only the overt symptoms but also the underlying genetic markers that might be contributing to the puzzle. By comparing this patient's data with others who share similar traits, you're not only honing in on potential causes but also gaining insights that transcend individual cases.
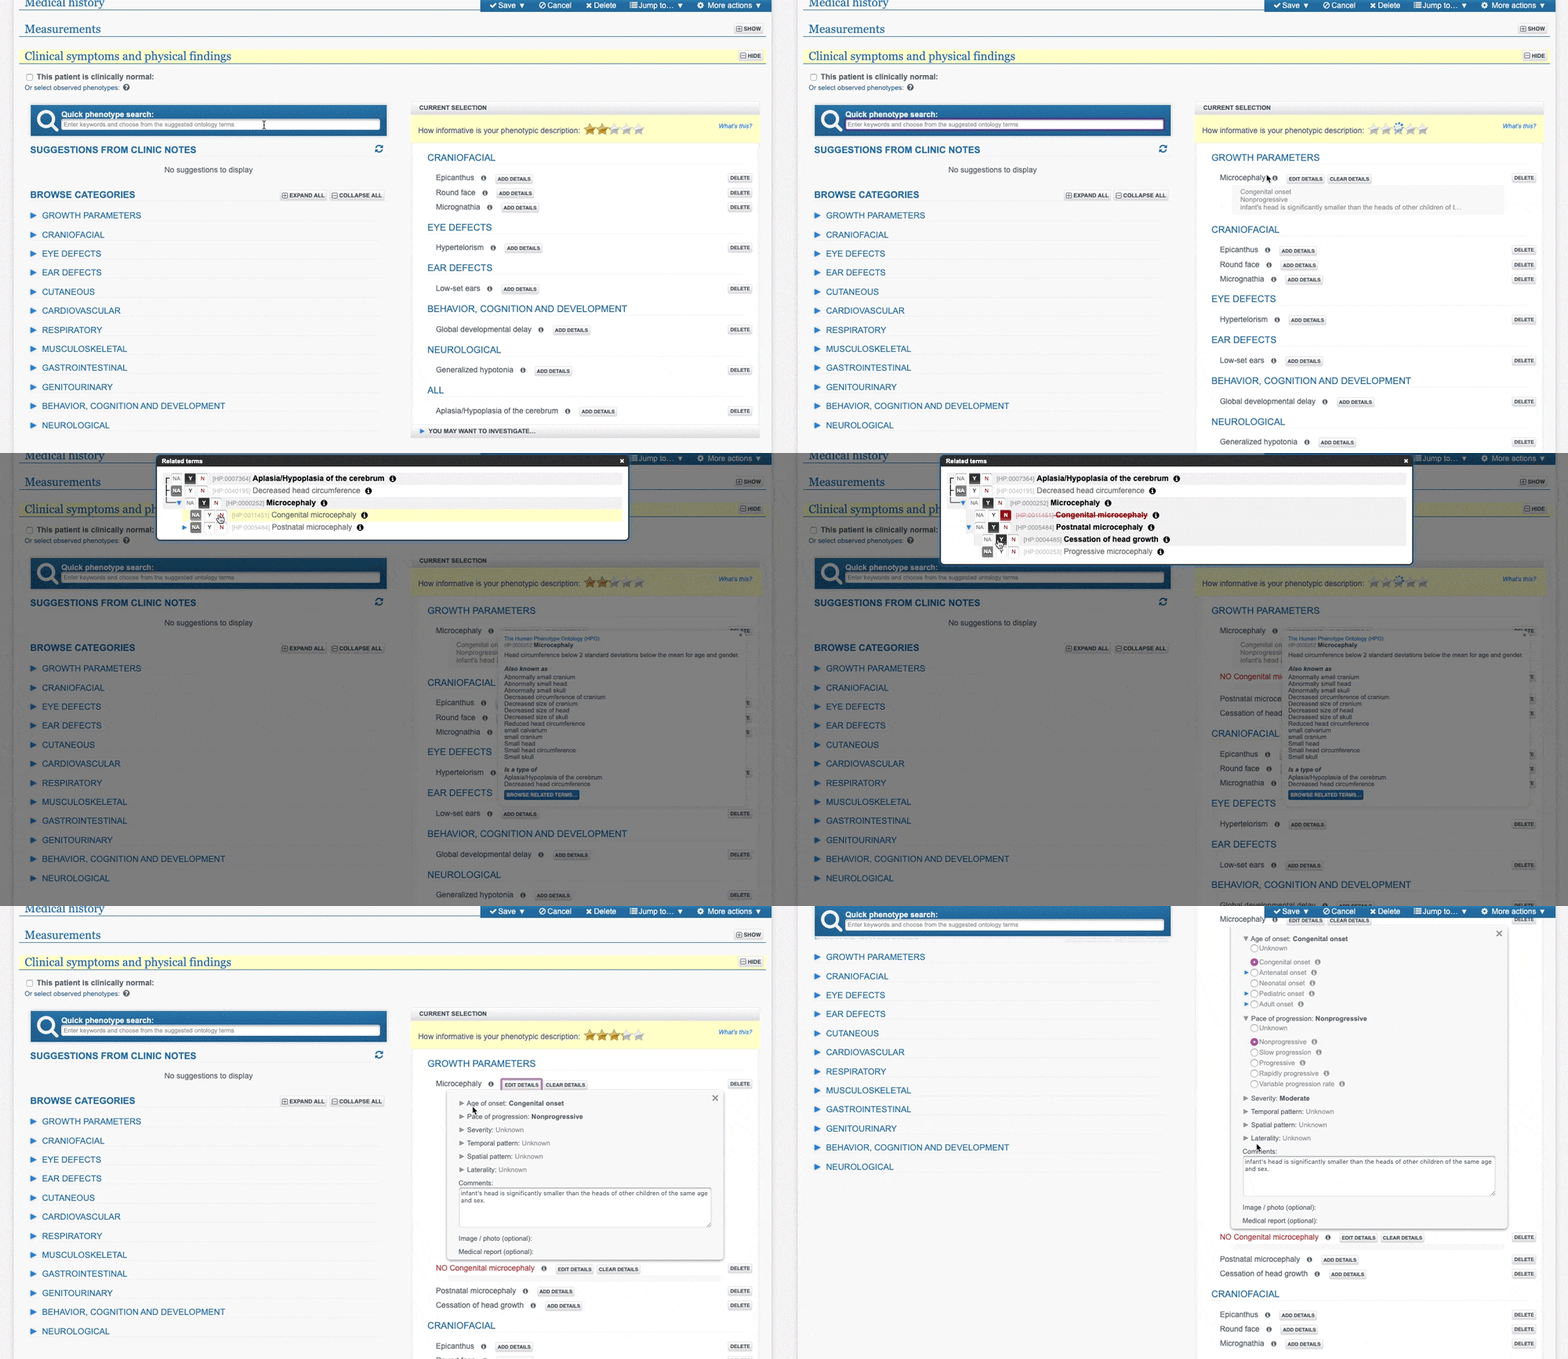
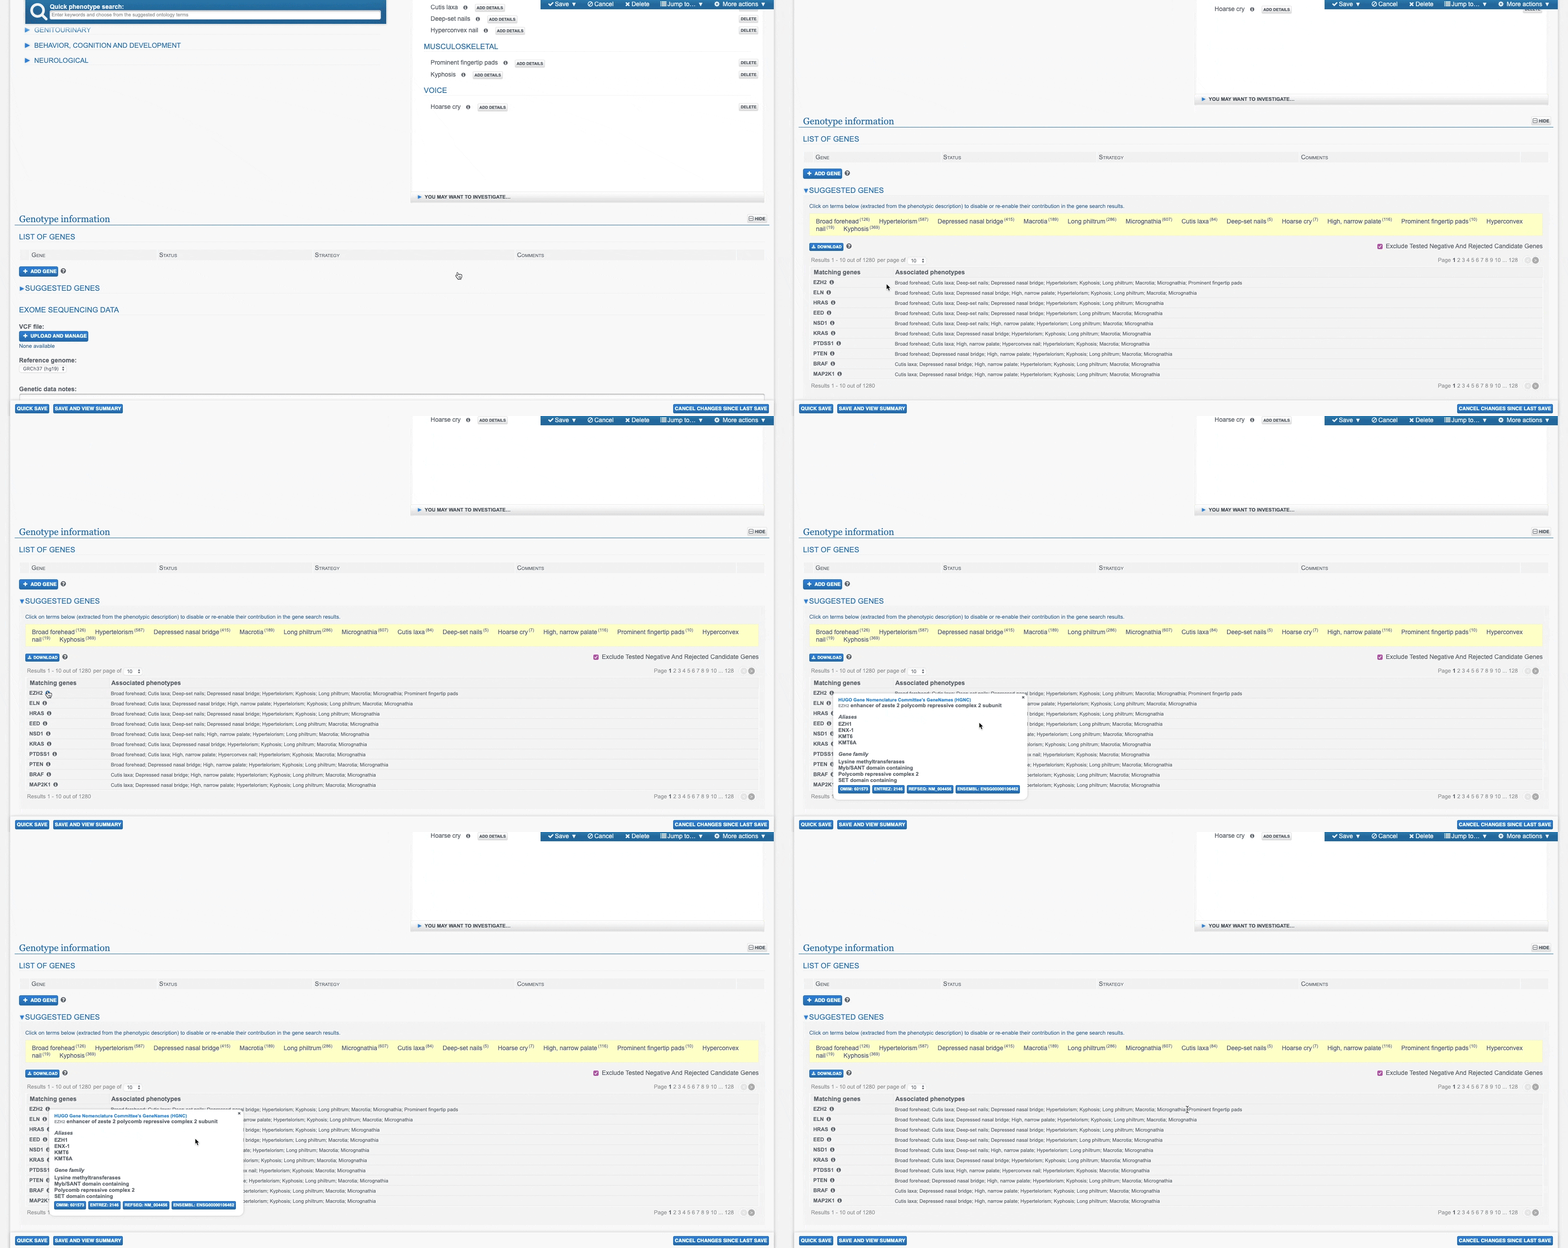
But let's take it a step further. PhenoTips takes your structured data and offers intelligent suggestions. As you enter details about a patient, our platform offers an easy-to-browse catalogue of phenotypes and suggests genes and potential diagnoses based on the information you provide.
And here's where the magic truly happens: Armed with these insights, you can tailor interventional treatments like never before. Whether it's a targeted therapy, precision medicine approach, or even a personalized patient care plan, structured data ensures that every decision is informed by a wealth of information. Your patient isn't just a case – they're a unique genetic story waiting to be read, understood, and transformed into a roadmap for better health.

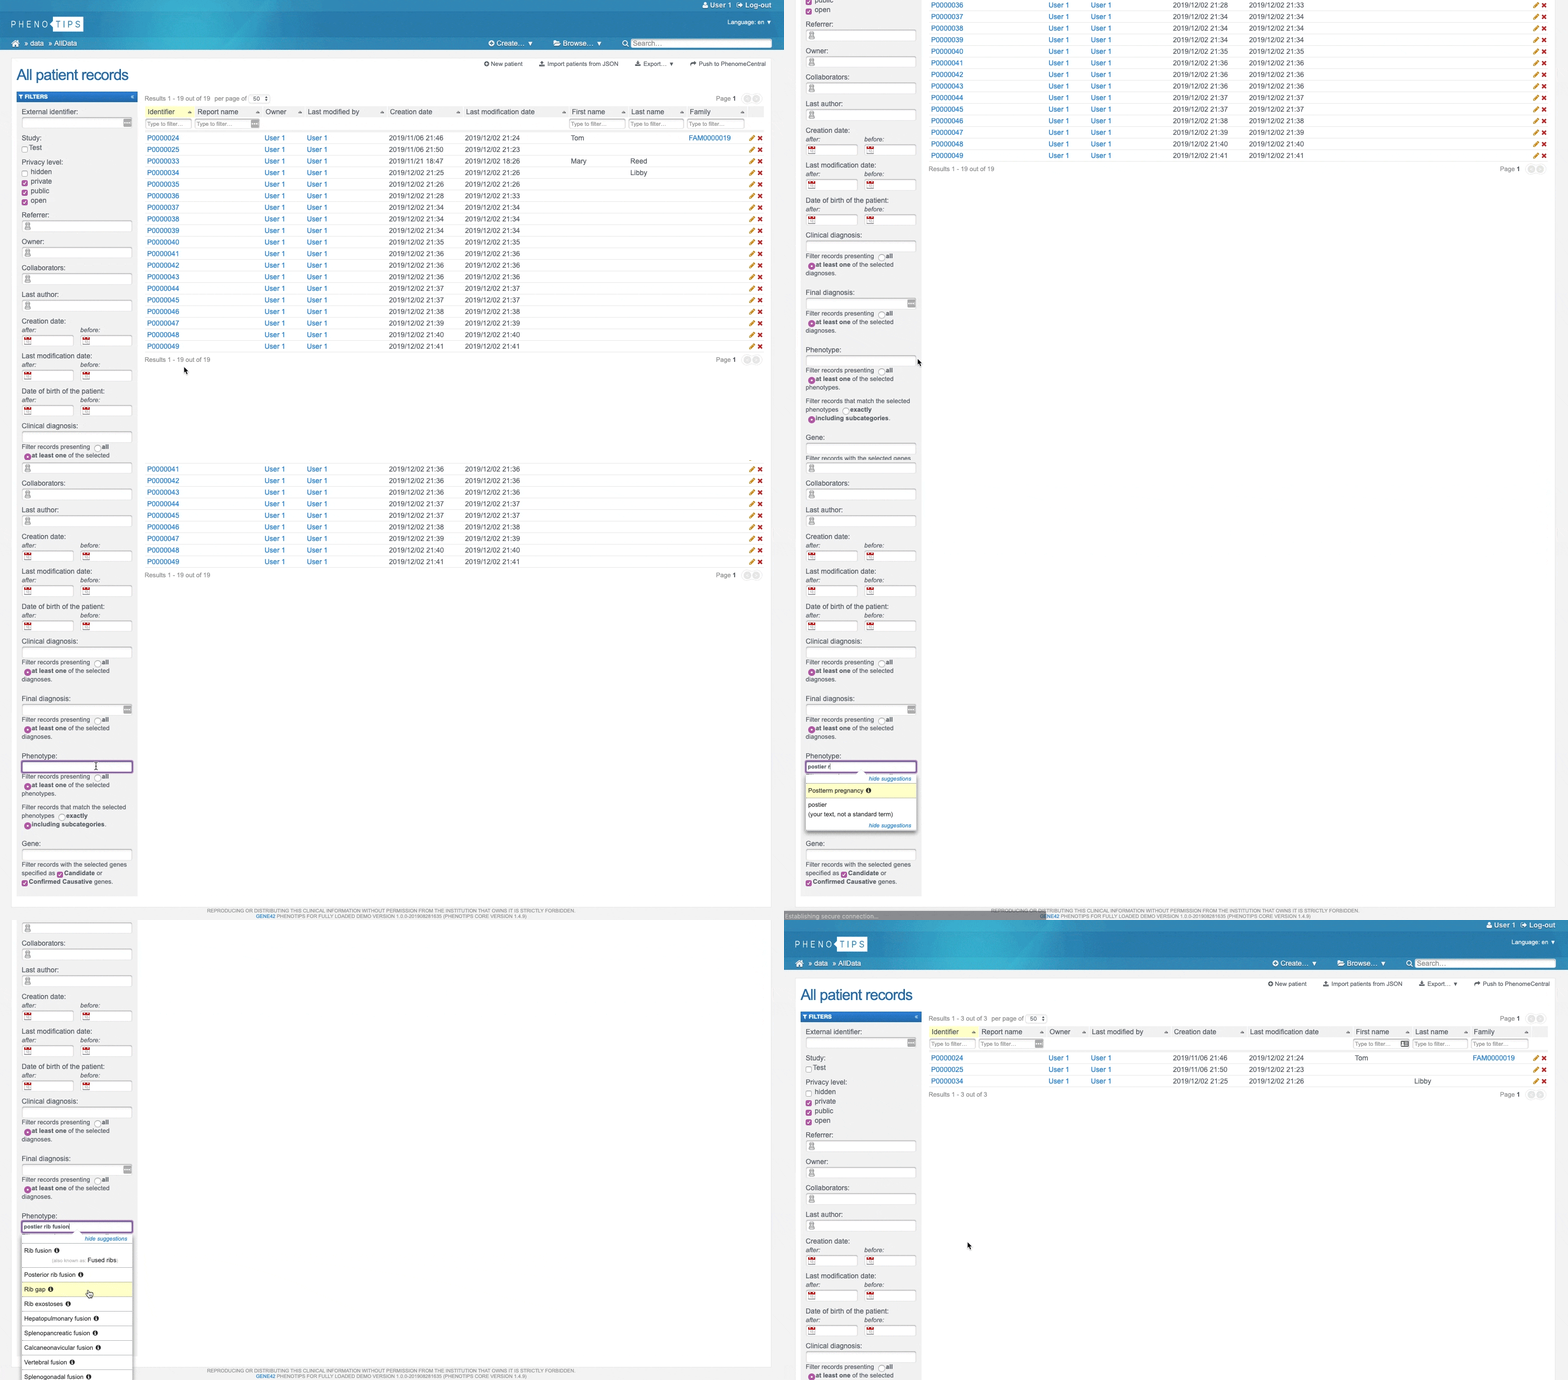
Now, let's take a peek at PhenoTips' browse and export functionalities. It's not just about scrolling through entries one by one - it's about transforming your structured data into actionable insights. Need to create cohorts for a study? Easy. Looking to identify patients for follow-up? Done. The power to navigate and export structured data puts you in the driver's seat, helping you make informed decisions with a few clicks.
The ‘Browse Patients' and ‘Browse Families’ sections of the platform offer advanced filtering mechanics to allow you to find a specific subset of patients or families. Take an example that came up in conversation with one of our clients: they have protocols for follow-up visits for patients with the BRCA1 gene based on their age. By inputting this gene along with a date of birth range into the filters, you can quickly see any patients that match your specified criteria in your PhenoTips database. Then, you can simply hit the export button (as a spreadsheet or JSON object), refine the parameters of your output even further if you wish, and create a worklist of patients for your department to contact.

Structured data isn't just about tidying up your records; it's about revolutionizing the way you approach patient care and research. With PhenoTips, structured data becomes your trusty sidekick, helping you uncover insights, navigate complexities, and make impactful strides.
So, here's to the structured data superheroes – you, PhenoTips, and the incredible journey of discovery that lies ahead. Ready to dive in? Your clinical insights are waiting to be unlocked, one structured entry at a time.
Speak with one of our experts to discover how your data can work for you.
Learn More