4 Easy Steps to Get Started with PhenoTips
New to PhenoTips and unsure where to start? Here are 4 simple steps to get you on your way.
Michael Berger

New to PhenoTips and unsure where to start? Here are 4 simple steps to get you on your way.

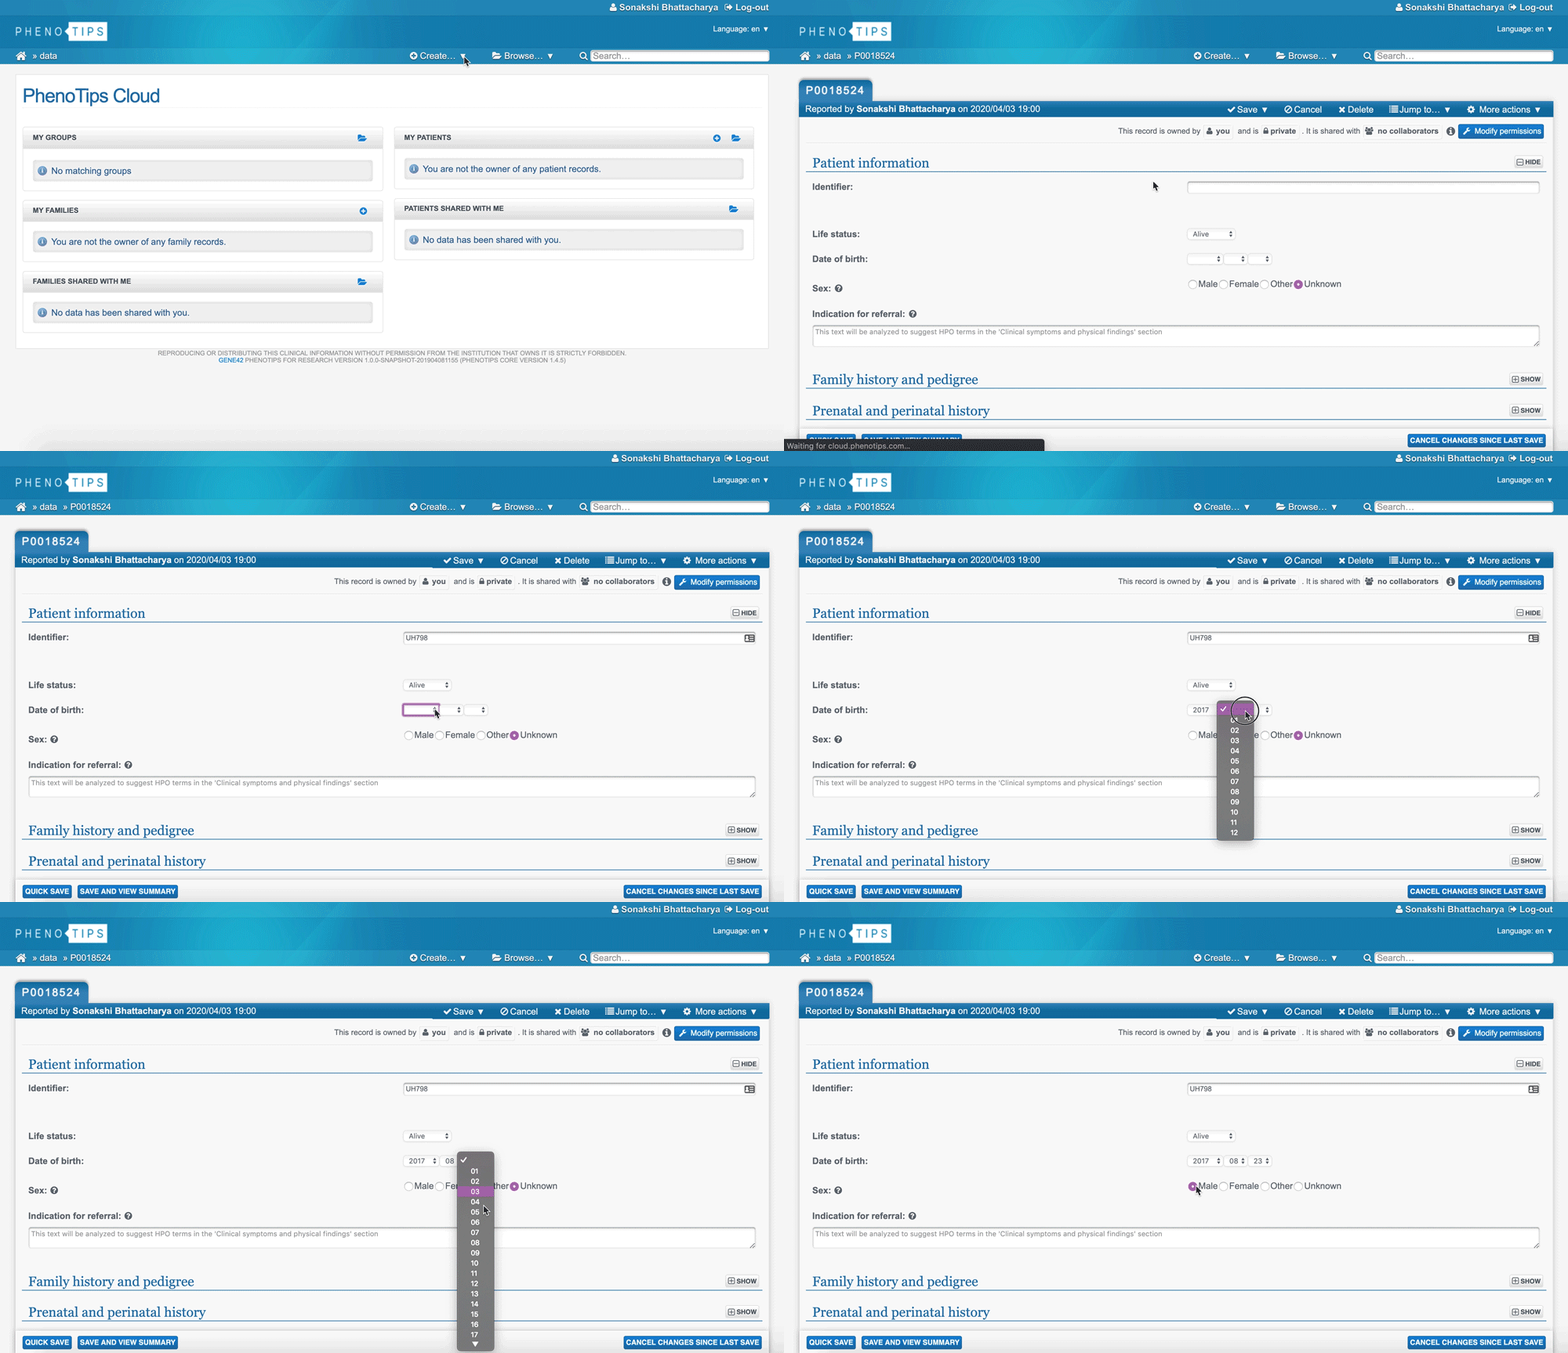
To get started, create a new patient record by hovering over “+ Create” in the header and selecting “New patient”. Input date of birth, sex and other relevant patient info.
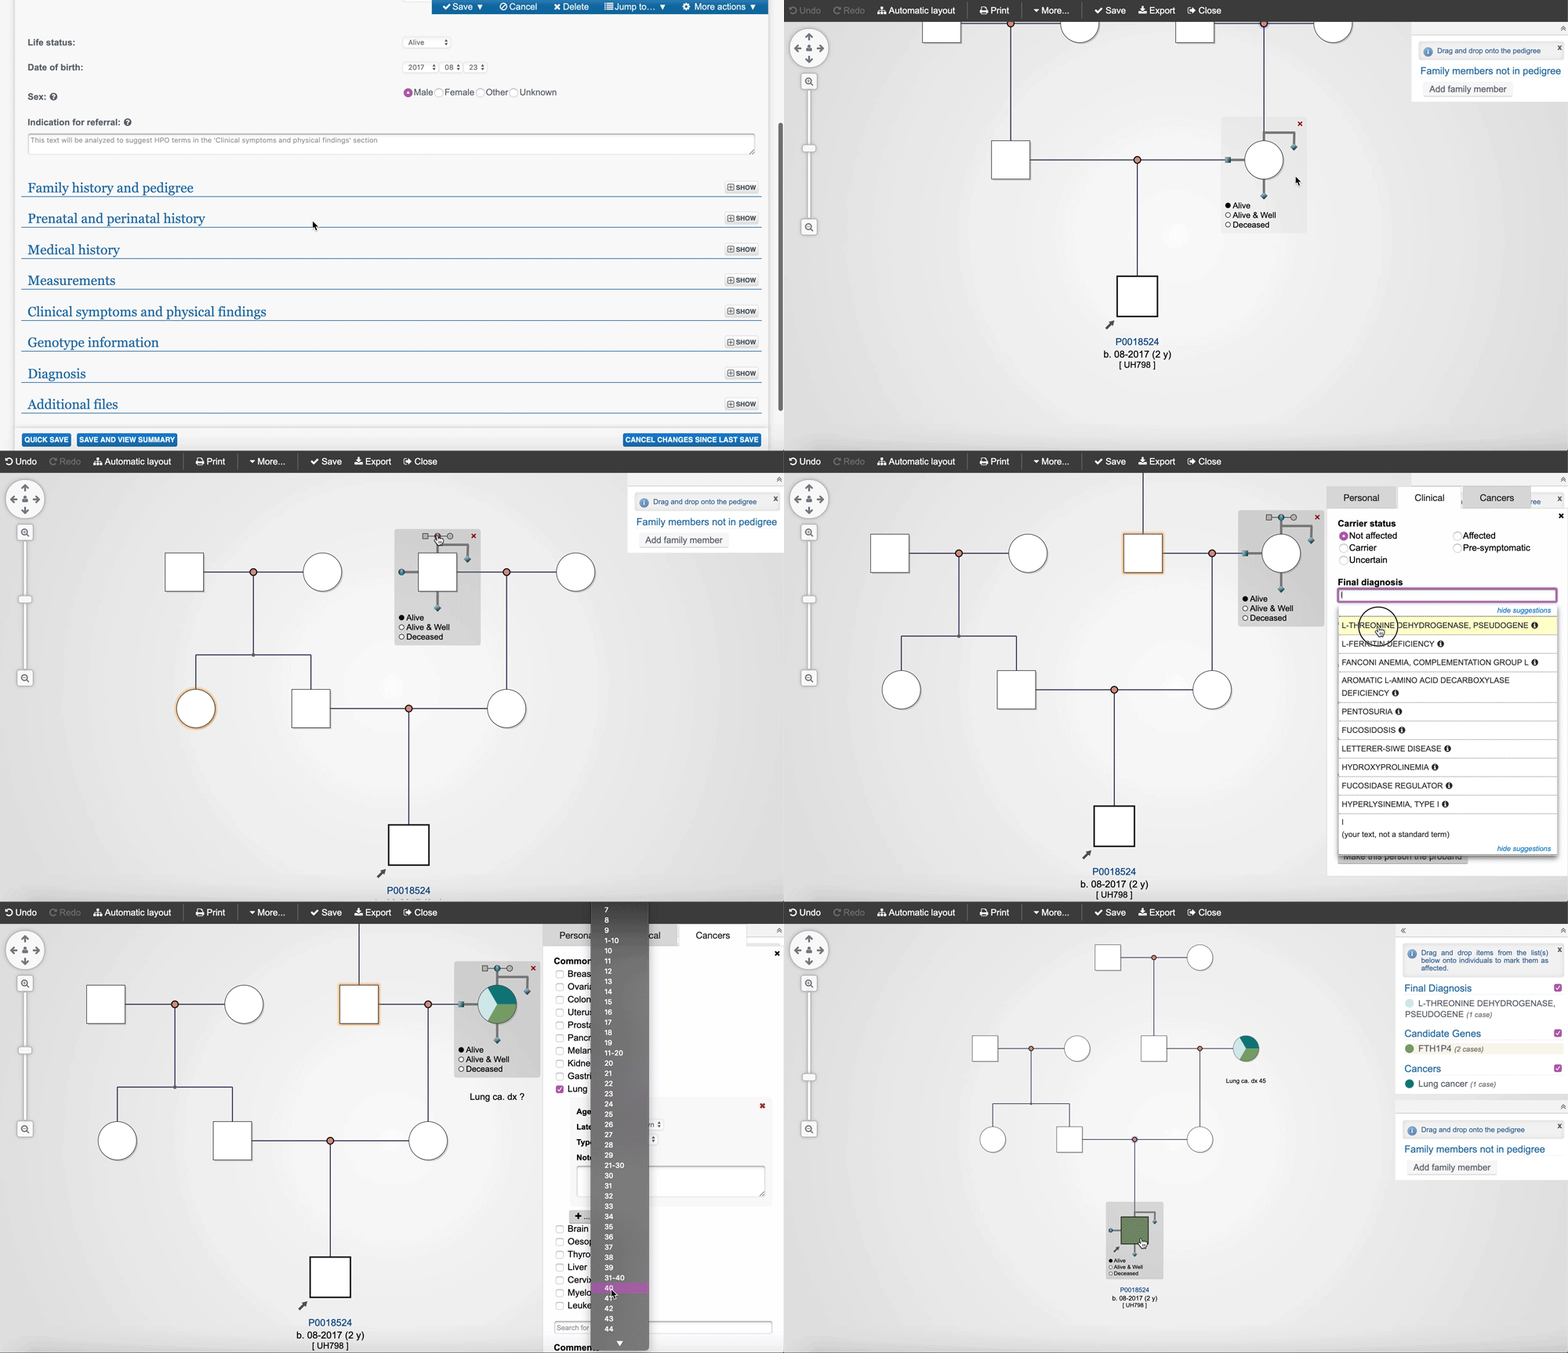
Open the “Family history and pedigree” section of your patient record and click “Draw pedigree”. Select a template that looks the most like your desired structure, and then add individuals (nodes) using the handles that appear when you hover on a node. Selecting nodes lets you add personal details including cancers, phenotypes, genes, and diagnoses. Once a cancer, phenotype, gene, or diagnosis is assigned to any node in the pedigree, you can drag and drop it from the legend on the right to any other node in the pedigree.
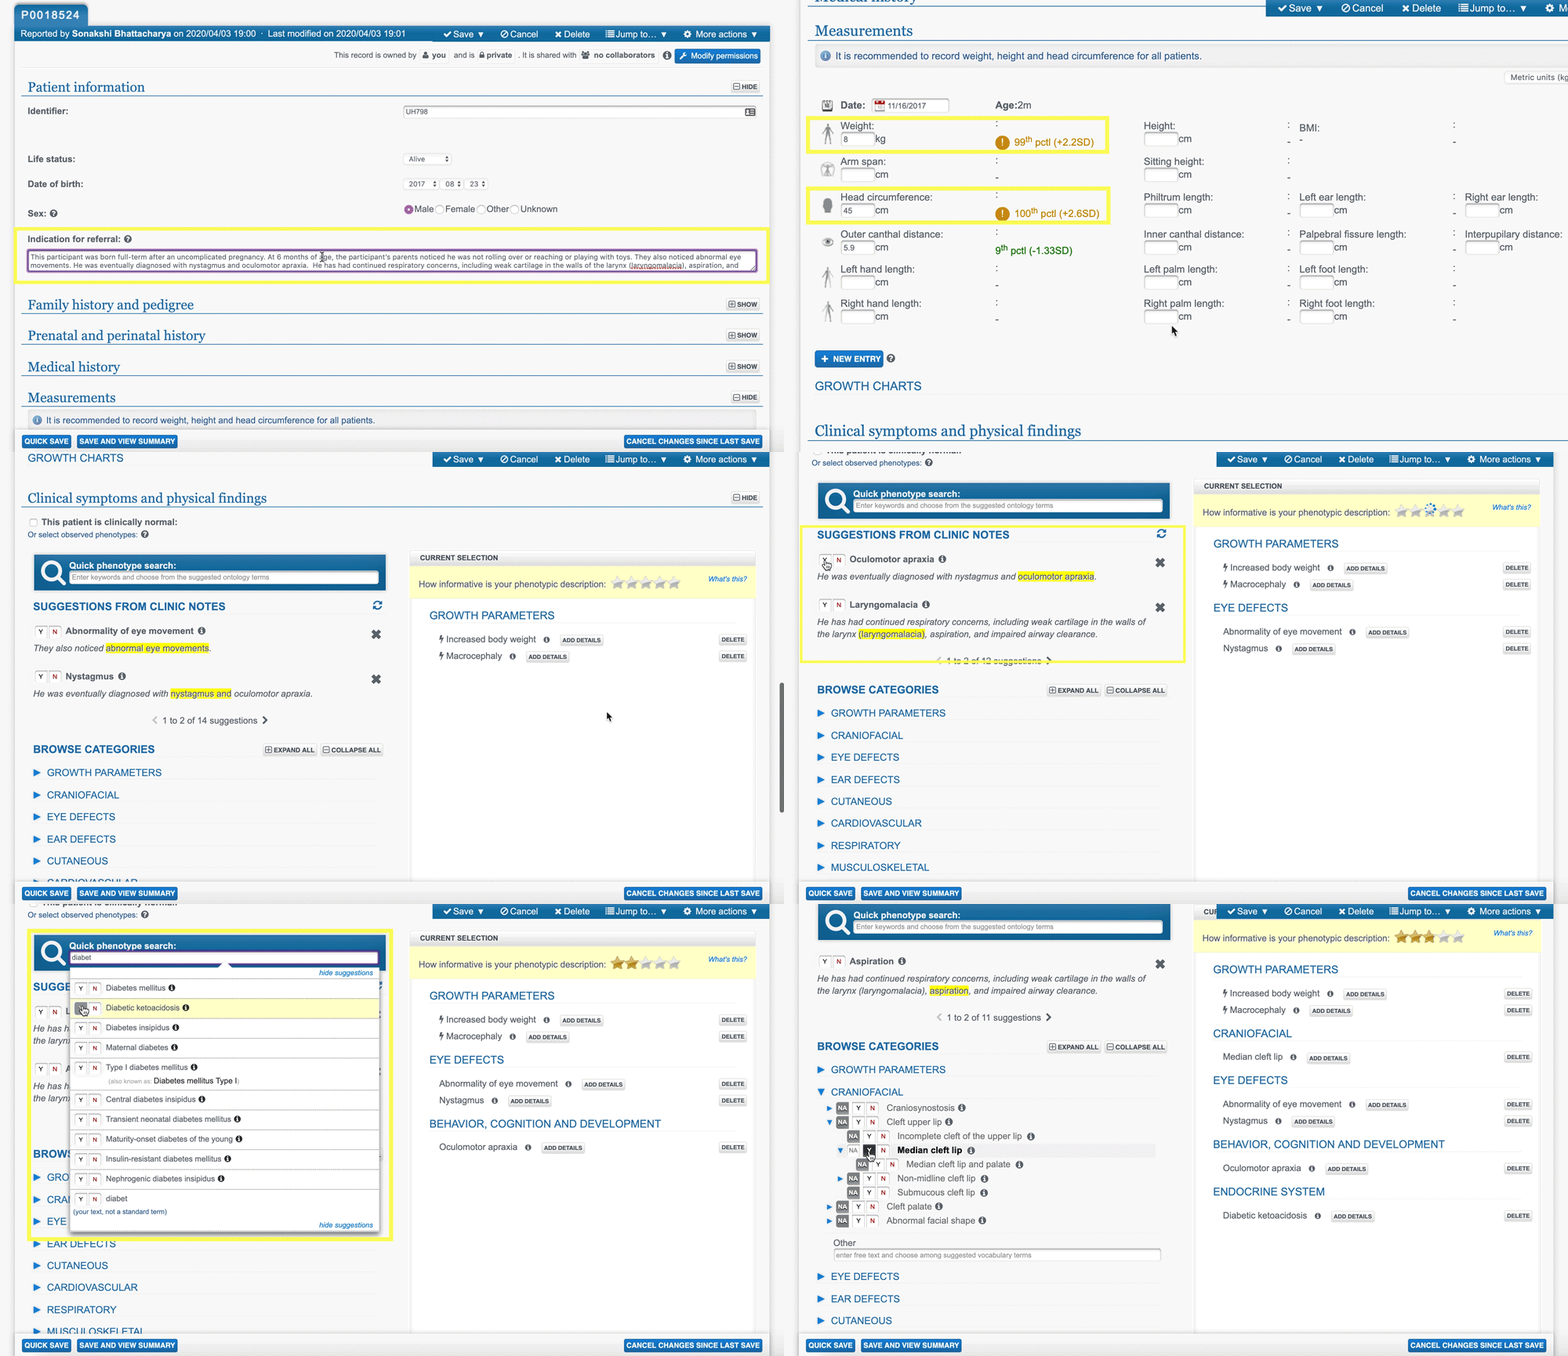
Enter standardized symptoms in the “Clinical symptoms and physical findings” section using the Human Phenotype Ontology (HPO). In this section, view phenotypes added automatically from abnormal measurements in the “Measurements” section, marked by lightning symbols. Confirm phenotype suggestions pulled from free-text clinical notes previously entered in the “Patient information” or “Medical history” sections. To enter phenotypes directly, use a quick predictive search or browse categories.
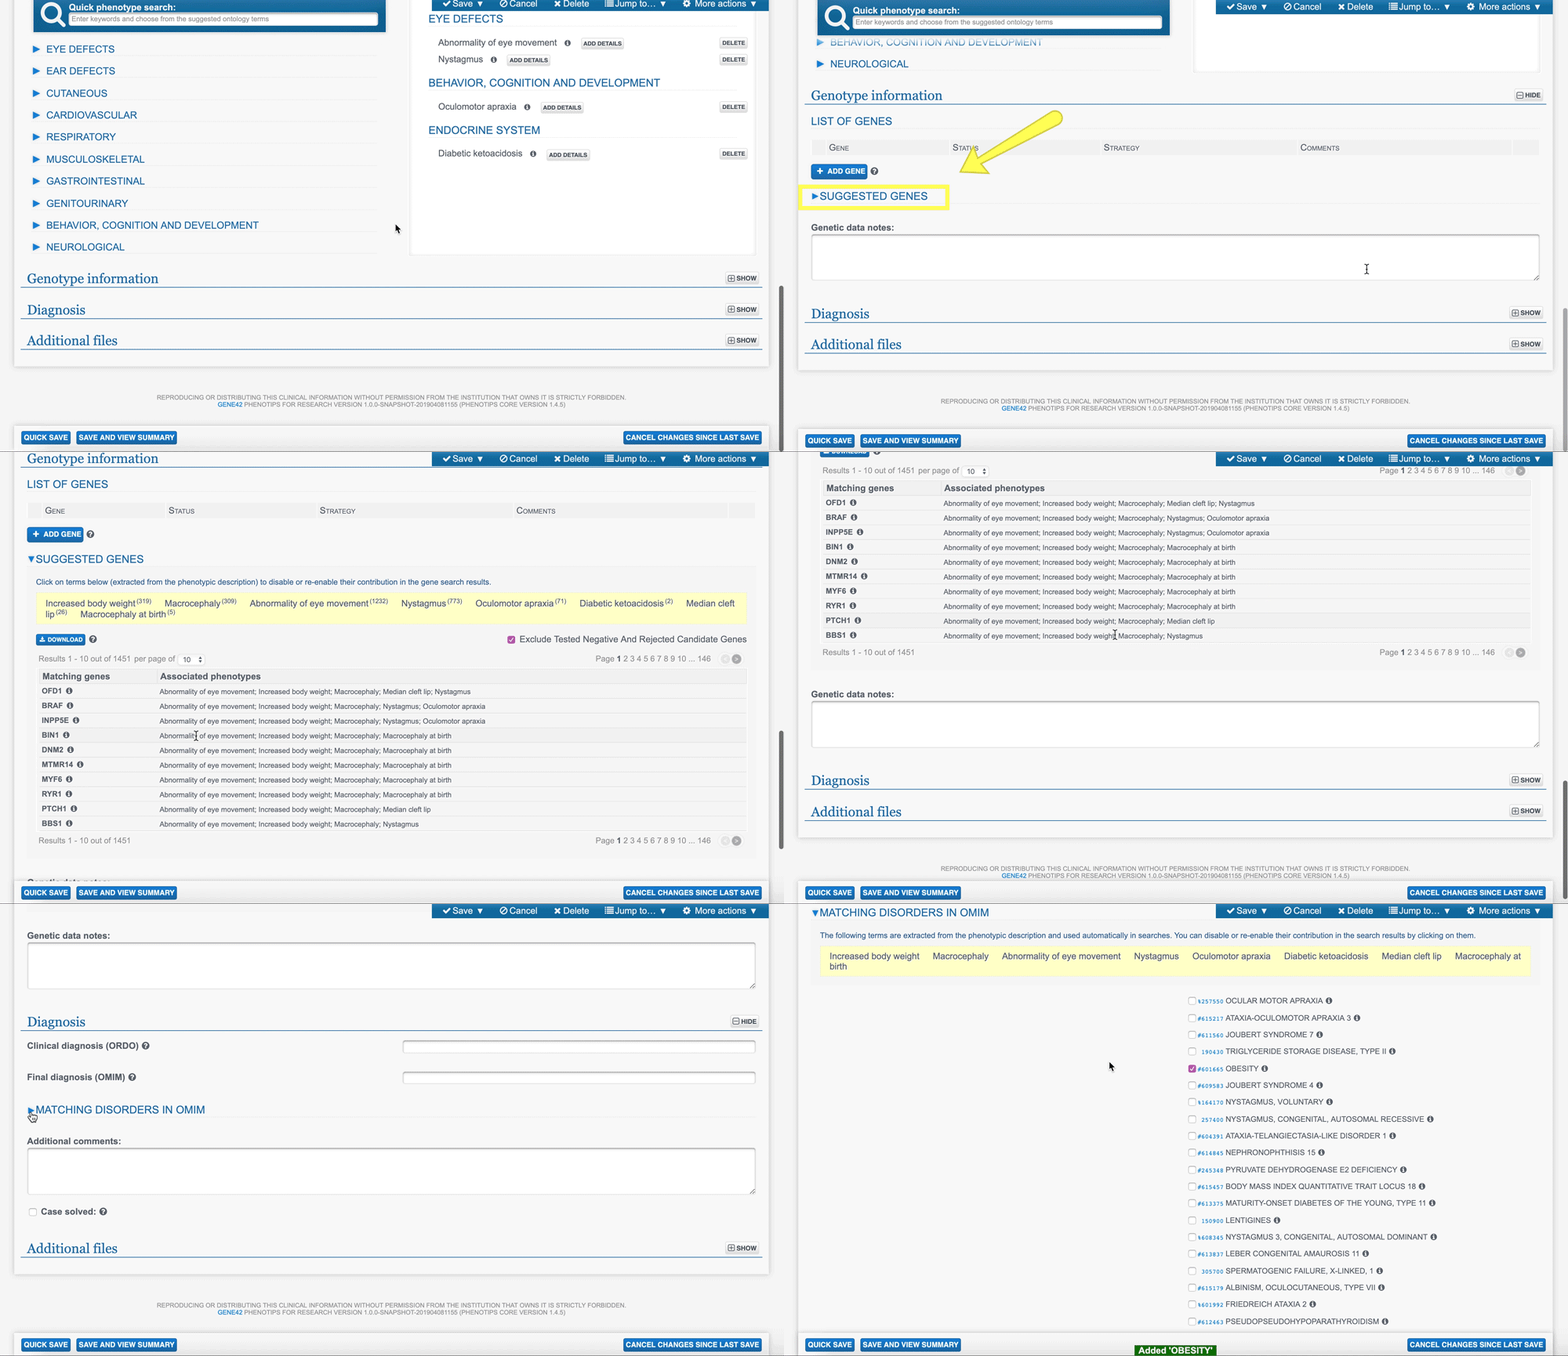
Take advantage of your high quality phenotypic data and use artificial intelligence to get insights. Use the “Genotype information” section to view probable genes based on your phenotypic profile. Use the “Diagnosis” section to view and confirm diagnosis suggestions based on your phenotypic profile.
